Coronavirus on Social Media: Analyzing Geographical Distribution
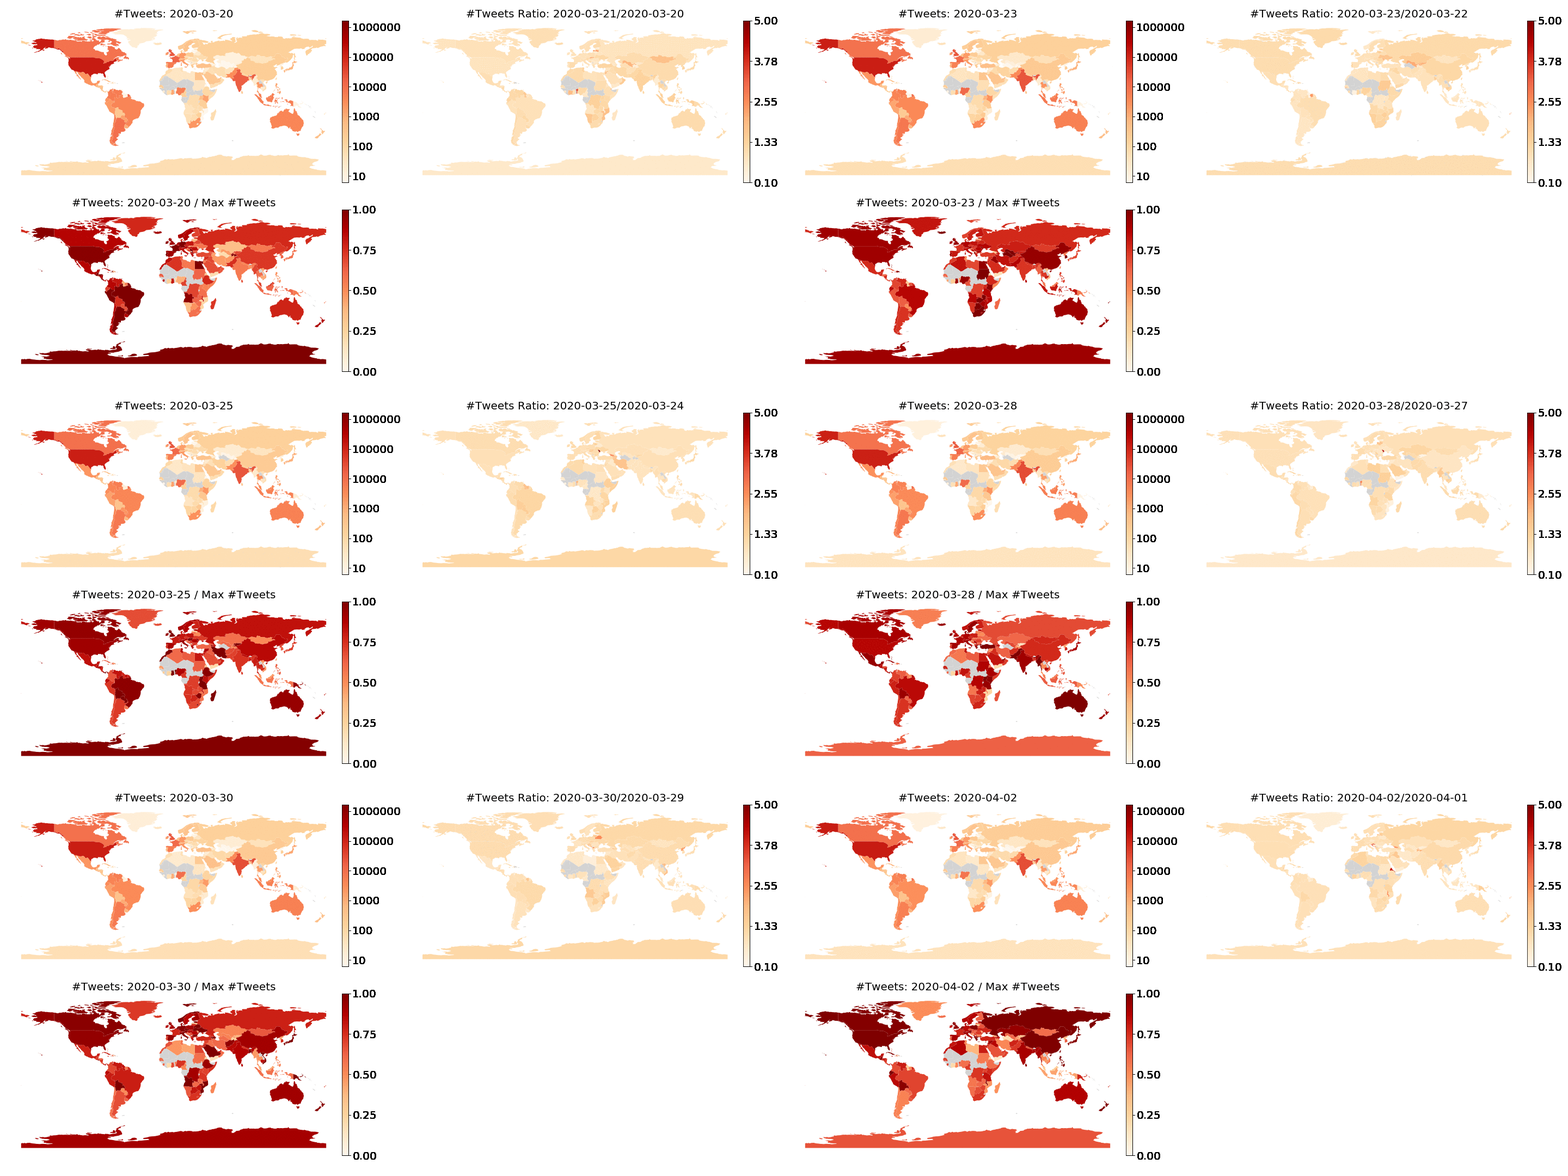
Social media collects posts from users around the world. After analyzing over 2 million tweets with geographical information collected from 2020-03-20 to 2020-04-02, we show
- Upper left: the daily geographical distribution of the count of tweets (in log scale).
- Upper right: the daily increasement of the count of tweets (measured as #TweetsToday/#TweetsYesterday).
- Lower left: each country's daily ratio of "the count of tweets in the current day" to "the highest count of tweets in a day from this country observed in the given time range". This figure reveals for each country when the peak of counts of tweets arrives.
