We present analysis of the Covid-19 spread based on our SIR prediction model. A notable difference from other analyses is the fact that we our analysis is informed by the internal hidden states of our SIR model rather than only the reported data.
Spread
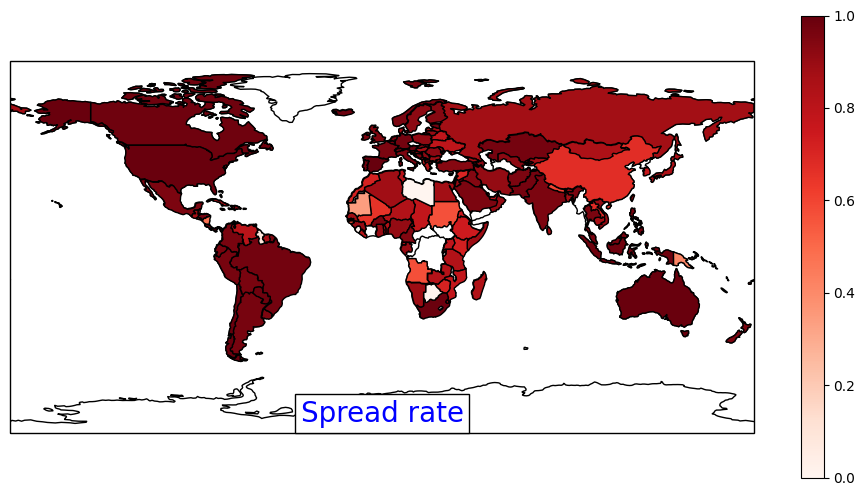
The first and most important parameter in the SIR model is λ, which is proportional to the infection spread rate within a local community. Treating each country as an approximate local community, we show the estimated spread rate λ (normalized between 0 and 1) for each country via a red color map. Our predicted spread parameters are consistent with the rapid internal spread happening currently in the United States, Canada, South America, Europe and Australia. Our predicted λ value is lower for China due to effective recent mitigation via their intervention policies.
Reporting
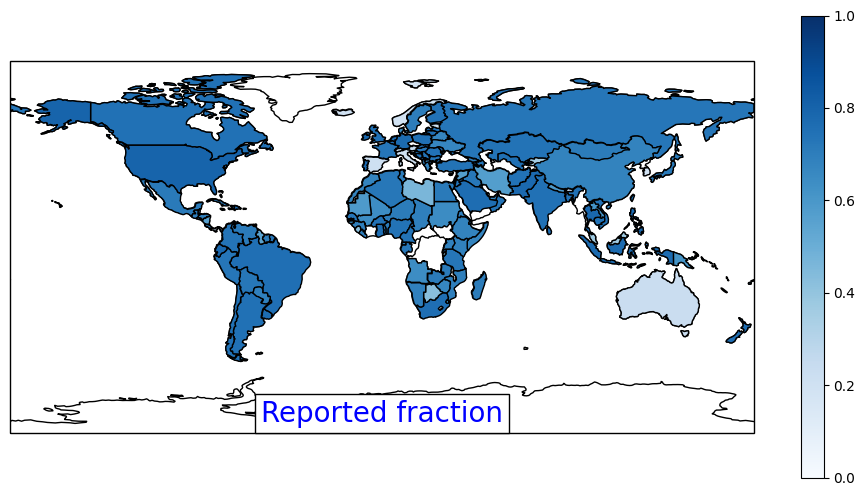
Our modeling is also informed by the fact that the reported infection cases are only a fraction of the total number, either due to under-reporting or lack of testing facility. Our SIR model provides a rough estimate of the reported fraction of cases, which we show below using a blue color map. While all countries understandably have only a fraction of cases being reported, the under-reporting is quite severe in Australia and Italy, while still being somewhat severe in China.
Visualization
Next we visualize how the disease has spread between late January till the beginning of April. We show a running visualization of our estimated prediction of infected population in each country via a red color map below. The green arrows in each frame show the top 40 source and destination countries between which our model predicts a high volume of infectious people traveling on a particular day. Our results are largely in agreement with spread analyses from phylogenetic sequence based tracking and we list some salient observations here:
- 22 Jan -25 Jan: China has a large infected population and is the epicenter of spread for Covid-19.
- 26 Jan - 30 Jan: Australia, Europe and US witness growing infections and the infection has begun to spread to Middle Eastern countries and the Indian peninsula.
- 31 Jan - 21 feb: Infection continues to spread throughout the world primarily due to travel from China which has a very large number of infected people in this duration.
- 22 Feb - 25 Feb: Japan, Italy, US and Australia are also highly infected.
- 26 Feb - 3 Mar: The virus is now rapidly spreading internally in Europe primarily through Italy as a second epicenter. The number of cases in Iran, US and Australia have also grown significantly high.
- 4 Mar - 1 Apr: Rapid community spread is happening in various countries all over the world and the number of infected people are rapidly rising. A major chunk of the world including Russia, India, South America and Middle East are now also severely infected.